State Emission Totals and Infographics
The annual Oklahoma Point Source Emissions Inventory is a data resource that utilizes emissions data to evaluate emission trends, support air dispersion modeling, aids in development of air quality rules, and air toxics risk assessment.
The National Emissions Inventory (NEI) is a comprehensive and detailed estimate of air emissions of Emissions Inventory System (EIS) first to collect the data from State, Local, and Tribal air agencies and then to blend that data with other data sources. More information can be found: https://www.epa.gov/air-emissions-inventories/national-emissions-inventory-nei
, criteria precursors, and hazardous air pollutants from air emissions sources. The NEI is released every three years based primarily upon data provided by State, Local, and Tribal air agencies for sources in their jurisdictions and supplemented by data developed by the US EPA. The NEI is built using theScroll below for DEQ’s interactive NEI dashboard.
Summaries of annual emissions from all Oklahoma permitted facilities are available to be downloaded as excel spreadsheets. These reports are provided as a basic informational resource for the general public.
For questions or to request specific emissions data, please contact us.
- 2023 Reported Emissions Data
- 2022 Reported Emissions Data
- 2021 Reported Emissions Data – updated August 29, 2023
- 2020 Reported Emissions Data – updated August 29, 2023
- 2019 Reported Emissions Data – updated August 29, 2023
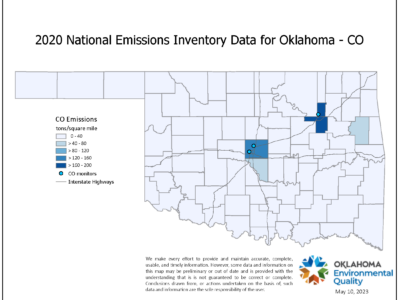
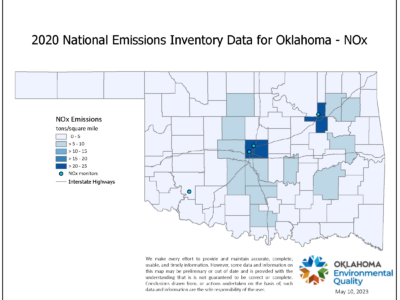
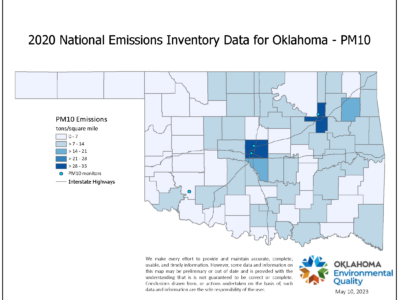
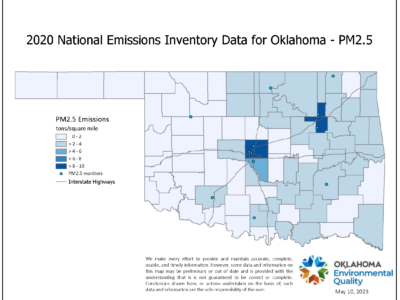
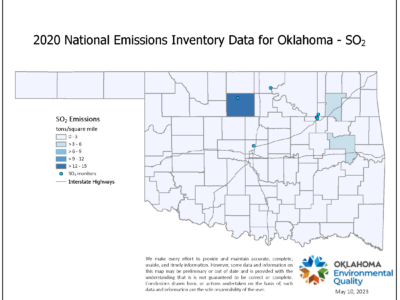
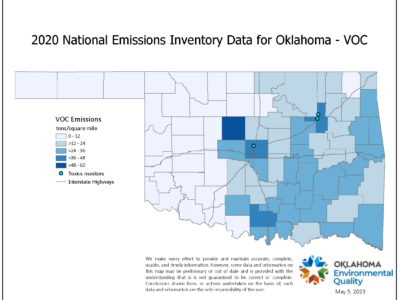
The most current Oklahoma NEI
and emissions data are presented in a series of maps. Individual pollutants in tons per square mile per county are represented on state maps.Click pollutant names for pollutant information. Click thumbnails for full map.

The oil and gas sector is one of the largest sources of employment and revenue in the state. When the various segments are combined (exploration, production, gathering, processing, storage, transmission, and distribution), this sector represents one of the largest emitters of VOC and NOx in Oklahoma. For this reason, it is important to have reasonably accurate information concerning facilities (reasonable estimates for small facilities and accurate information for large facilities) and, when combined, robust estimates of emissions from this sector. Therefore, DEQ's Emissions Inventory Section has prioritized improving the characterization and accuracy of oil and gas sector data submitted to the National Emissions Inventory (NEI). Emissions data for the oil and gas sector come from two main sources:
- The annual point source inventory of permitted facilities and
- Nonpoint emissions from the National Nonpoint Oil and Gas Emissions Estimation Tool.
The Tool is used to estimate emissions from oil and gas exploration activities (drilling operations, well completions, etc.), unpermitted well sites, and unpermitted compressor stations. The Tool uses well counts, production data, and basin-specific emission factors to estimate emissions aggregated at the county level. The "History of Emissions Estimates" tab documents the improvements that have been made in estimating oil and gas sector emissions,.
Facility Type | Before 2008 | 2008 NEI | 2011 NEI | 2014 NEI | 2017 NEI | 2020 NEI |
Not inventoried | CenRAP Study | National Nonpoint Tool | National Nonpoint Exploration Tool | |||
National Nonpoint Production Tool + aggregated permitted wells + Oklahoma pneumatic device study | ||||||
Inventoried but not submitted to EPA | Inventoried and submitted to EPA as an aggregated nonpoint source | Inventoried and submitted to EPA as point sources | Inventoried and submitted to EPA as point sources + National Nonpoint Production Tool for "residual," unpermitted compressor stations | |||
Inventoried and submitted to EPA, as required by CERR | Inventoried and submitted to EPA, as required by AERR |
NEI Dashboard
DEQ has created an interactive dashboard to explore Oklahoma's triennial NEI data.