Mercury In Fish
Click here for the updated 2023 Mercury in Fish booklet.
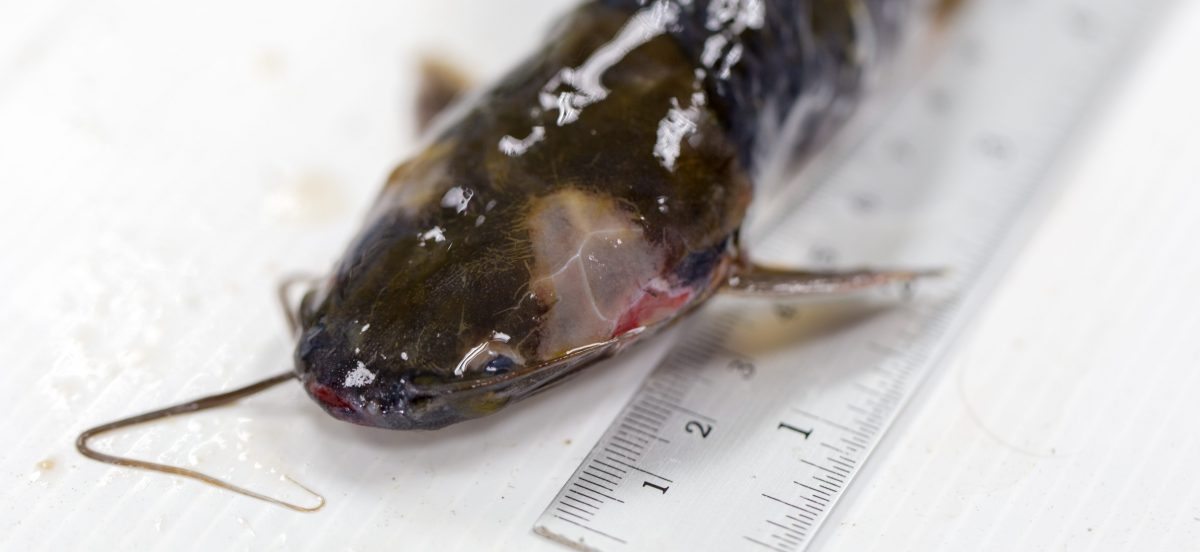
The Environmental Protection Agency (EPA) began a cooperative effort in 1995 to assemble a nationwide database of total mercury concentrations in fish tissue. The first objective of this project was to assemble and review data on the mercury contamination in fish tissue. This step included identifying appropriate entities, such as Oklahoma DEQ, state and federal agencies, and other groups with relevant data on mercury concentrations in fish populations. The second step in this project involved the development of a fish tissue database for compiling and organizing relevant data to be used for future evaluations and analyses. Initially EPA focused data compilation efforts on obtaining results of state monitoring efforts from the years 1990-1995. These data sets can be used to derive estimates of mercury concentrations in fish tissue by determining the number and frequency of samples (see chart below) collected and analyzed by the state, and calculate descriptive statistics on mercury concentrations in fish tissue. The current database will facilitate EPA’s ability to determine additional and future data needs and may be used to identify and evaluate factors affecting mercury contamination in fish.
| Fish Tissue Concentrations (mg/kg) | Consumption Rate (Meals per Month) Sensitive Population* | Consumption Rate (Meals per Month) General Population* |
| < 0.5 | No Advisory | No Advisory |
| 0.5 – 1.0 | 2 Meals per Month | No Advisory |
| 1.0 – 1.5 | Consumption Not Recommended | 2 Meals per Month |
| > 1.5 | Consumption Not Recommended | Consumption Not Recommended |
*Sensitive population is defined as children less than 15 and women of childbearing age (15-45). General population is men older than 15 and women older than 45. Meal size is 8 oz. with the assumption that younger children will eat smaller meals.